图像处理与边缘检测学习报告(较为概括)
项目简介
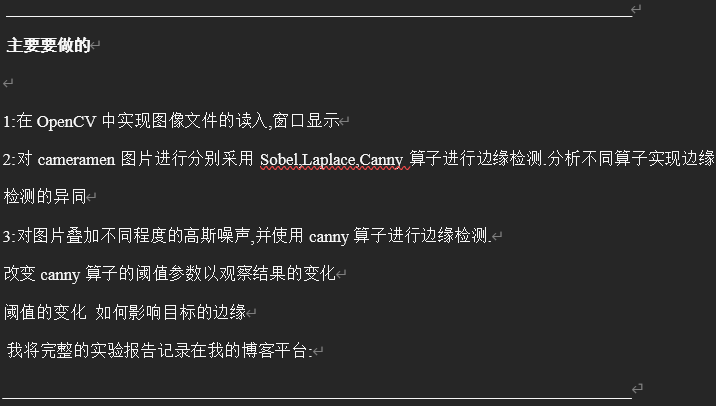
这份代码是我学习计算机视觉(CV)的第一个实验,用 Python 和 OpenCV 实现了一些基本的图像处理功能。我通过这个项目学会了如何读取图片、显示图片,还尝试了三种找边缘的方法,最后还研究了噪声和参数对边缘检测的影响。
环境准备
- 编程语言: Python
- 需要的库:
- OpenCV (cv2):处理图像。
- NumPy (np):计算数字。
- Matplotlib (plt):画图展示。
- 安装方法:
conda create --name cv
python=3.12 conda activate cv
pip install opencv-python numpy matplotlib
代码结构
- 读图和显示: 把图片读进来并展示。
- 边缘检测比较: 用三种方法找边缘。
- 噪声和 Canny 测试: 加噪声,看看 Canny 怎么受影响。
- 主函数: 把所有步骤跑一遍。
详细功能说明
1. 图像读入与显示
- 代码:
def read_and_display_image(image_path):
    img = cv2.imread(image_path, cv2.IMREAD_GRAYSCALE)
    cv2.imshow("Original Image", img)
    cv2.waitKey(0)
return img- 作用: 把图片从文件变成数字,再显示出来。
- 细节:
- 用 cv2.imread 读图,转成灰度。
- 用 cv2.imshow 显示,cv2.waitKey 等你看完。
- 返回图片数据给后面用。
2. 边缘检测比较
- 代码:
def edge_detection_comparison(img):
    sobel_x = cv2.Sobel(img, cv2.CV_64F, 1, 0, ksize=3)
    sobel_y = cv2.Sobel(img, cv2.CV_64F, 0, 1, ksize=3)
    sobel = np.sqrt(sobel_x**2 + sobel_y**2)
    sobel = np.uint8(sobel)
    laplace = cv2.Laplacian(img, cv2.CV_64F)
    laplace = np.uint8(np.absolute(laplace))
    canny = cv2.Canny(img, 100, 200)
    cv2.imshow("Sobel Edge", sobel)
    cv2.imshow("Laplace Edge", laplace)
    cv2.imshow("Canny Edge", canny)
cv2.waitKey(0)- 作用: 用三种方法找图片的边缘,展示结果。
- 细节:
- Sobel: 检查水平和垂直变化,合并成总边缘。
- Laplace: 找亮度变化大的点。
- Canny: 用阈值找更干净的边缘。
- 显示三种结果让你对比。
3. 噪声与 Canny 测试
- 代码:
def noise_and_canny(img):
    def add_gaussian_noise(image, mean=0, sigma=25):
        gauss = np.random.normal(mean, sigma, image.shape)
        noisy = image + gauss
        noisy = np.clip(noisy, 0, 255)
        return np.uint8(noisy)
    noise_low = add_gaussian_noise(img, sigma=15)
    noise_medium = add_gaussian_noise(img, sigma=30)
    noise_high = add_gaussian_noise(img, sigma=50)
    thresholds = [(50, 150), (100, 200), (150, 250)]
    plt.figure(figsize=(15, 10))
    for i, (img_var, title) in enumerate([(img, "Original"), (noise_low, "Low Noise"), (noise_medium, "Medium Noise"), (noise_high, "High Noise")]):
        for j, (low, high) in enumerate(thresholds):
            canny_result = cv2.Canny(img_var, low, high)
            plt.subplot(4, 3, i * 3 + j + 1)
            plt.imshow(canny_result, cmap="gray")
            plt.title(f"{title}\nThreshold: {low}-{high}")
            plt.axis("off")
    plt.tight_layout()
plt.show()- 作用: 加噪声,用不同阈值测试 Canny。
- 细节:
- 加三种噪声(低、中、高)。
- 用三组阈值跑 Canny。
- 用 Matplotlib 显示 12 张图,方便比较。
4. 主函数
- 代码
def main():
    image_path = "Cameraman.tif"
    img = read_and_display_image(image_path)
    edge_detection_comparison(img)
    noise_and_canny(img)
    cv2.destroyAllWindows()
if __name__ == "__main__":
main()- 作用: 把所有功能跑一遍。
- 细节:
- 指定路径,读图。
- 跑边缘检测和噪声测试。
- 最后关窗口。
学习收获
- 基础操作: 学会了用 OpenCV 读图和显示。
- 边缘检测: 明白了 Sobel、Laplace 和 Canny 的区别。
- Sobel 简单粗暴,Laplace 敏感,Canny 聪明。
- 噪声影响: 发现噪声会让边缘变模糊,阈值高了边缘少但干净,低了细节多但乱。
- 工具使用: 掌握了 NumPy 计算和 Matplotlib 画图。
附:对代码的详细分析
1 导入库
cv2: 这是 OpenCV 库的 Python 接口,用于处理图像,比如读取、显示和进行边缘检测等操作。
numpy as np: NumPy 是一个数学计算库,用来处理数组(图像在代码中本质上是一个数组),比如计算平方根或生成随机数。
matplotlib.pyplot as plt: Matplotlib 是一个绘图库,这里用来展示多张图像的对比结果,比 OpenCV 的窗口更适合显示多个子图。
2 读图与显示
def read_and_display_image(image_path):
    # 读取图像
    img = cv2.imread(image_path, cv2.IMREAD_GRAYSCALE)
    # 创建窗口并显示图像
    cv2.imshow("Original Image", img)
    cv2.waitKey(0)
    return img
2.1 功能
这个函数的作用是从电脑里读取一张图片,然后显示出来。
2.2 代码解释
- img = cv2.imread(image_path, cv2.IMREAD_GRAYSCALE):
- cv2.imread 是读取图片的工具,image_path 是图片的路径(比如 “Cameraman.tif”)。
- cv2.IMREAD_GRAYSCALE 告诉 OpenCV 把图片变成灰度图(黑白图)。即使原图是彩色的,也会转成只有亮度信息的灰度图,这样处理起来更简单。
- 图像在电脑里其实是一个数字矩阵,每个数字代表一个像素的亮度(0 是黑色,255 是白色)。
- cv2.imshow(“Original Image”, img):
- cv2.imshow 会在屏幕上弹出一个窗口,窗口的名字是 “Original Image”,里面显示 img 这张图片。
- 这就像打开相册看照片。
- cv2.waitKey(0):
- 这个命令让程序停下来,等待你按键盘上的任意键。
- 参数 0 表示无限等待,直到你按键才会继续运行。这样你有时间看清楚图片。
- return img:
- 把读取的图片 img 返回给调用这个函数的地方,方便后面继续用它做处理。
2.3 逻辑
- 先找到图片文件,把它读进来变成灰度图。
- 在屏幕上显示这张图。
- 等你看完按键后,把图片数据传给下一个步骤。
3 不同边缘检测算子的实现
def edge_detection_comparison(img):
    # Sobel算子
    sobel_x = cv2.Sobel(img, cv2.CV_64F, 1, 0, ksize=3)
    sobel_y = cv2.Sobel(img, cv2.CV_64F, 0, 1, ksize=3)
    sobel = np.sqrt(sobel_x**2 + sobel_y**2)
    sobel = np.uint8(sobel)

    # Laplace算子
    laplace = cv2.Laplacian(img, cv2.CV_64F)
    laplace = np.uint8(np.absolute(laplace))

    # Canny算子
    canny = cv2.Canny(img, 100, 200)

    # 显示结果
    cv2.imshow("Sobel Edge", sobel)
    cv2.imshow("Laplace Edge", laplace)
    cv2.imshow("Canny Edge", canny)
    cv2.waitKey(0)
3.1 功能
这个函数用三种方法(Sobel、Laplace、Canny)找出图片里的边缘,然后显示出来。边缘就是图片中颜色或亮度变化明显的地方,比如物体的轮廓。
3.2 代码解释
3.2.1 Sobel 算子
- sobel_x = cv2.Sobel(img, cv2.CV_64F, 1, 0, ksize=3):
- cv2.Sobel 是用来找边缘的工具。
- img 是输入的图片。
- cv2.CV_64F 表示用高精度的数字(64位浮点数)计算,因为边缘检测可能会产生负数。
- 1, 0 表示只检查水平方向(x方向)的变化。
- ksize=3 表示用一个 3×3 的小窗口扫描图片。
- sobel_y = cv2.Sobel(img, cv2.CV_64F, 0, 1, ksize=3):
- 和上面类似,但这次检查垂直方向(y方向)的变化。
- sobel = np.sqrt(sobel_x2 + sobel_y2):
- 把水平和垂直方向的变化结合起来,计算总的边缘强度(用勾股定理)。
- 这就像测量一个斜坡的陡度。
- sobel = np.uint8(sobel):
- 把结果转成 0-255 的整数(8位无符号整数),因为显示图片只能用这种格式。
3.2.2 Laplace 算子
- laplace = cv2.Laplacian(img, cv2.CV_64F):
- cv2.Laplacian 是另一种找边缘的方法,它看的是亮度变化的“加速度”(二阶导数)。
- 它对小细节很敏感,但也容易被噪声干扰。
- laplace = np.uint8(np.absolute(laplace)):
- 因为结果可能有负数,取绝对值后再转成 0-255 的格式。
3.2.3 Canny 算子
- canny = cv2.Canny(img, 100, 200):
- cv2.Canny 是一种更高级的边缘检测方法。
- 100 是低阈值,200 是高阈值。这两个数字决定哪些边缘被保留。
- 它会先去掉噪声,再找边缘,最后连接边缘,比前两种方法更“聪明”。
3.3 显示结果
- cv2.imshow:
- 把三种方法的结果分别显示在三个窗口里,名字分别是 “Sobel Edge”、”Laplace Edge” 和 “Canny Edge”。
- cv2.waitKey(0):
- 等待你按键,好让你有时间对比三种结果。
3.4逻辑
- 用 Sobel 检查水平和垂直的边缘,然后合并。
- 用 Laplace 找亮度变化剧烈的地方。
- 用 Canny 找更连续、更干净的边缘。
- 把三种结果显示出来让你比较。
4 添加高斯噪声与 Canny 边缘检测
def noise_and_canny(img):
    # 创建不同程度的高斯噪声
    def add_gaussian_noise(image, mean=0, sigma=25):
        gauss = np.random.normal(mean, sigma, image.shape)
        noisy = image + gauss
        noisy = np.clip(noisy, 0, 255)
        return np.uint8(noisy)

    # 生成不同噪声水平的图像
    noise_low = add_gaussian_noise(img, sigma=15)
    noise_medium = add_gaussian_noise(img, sigma=30)
    noise_high = add_gaussian_noise(img, sigma=50)

    # 不同阈值的Canny边缘检测
    thresholds = [(50, 150), (100, 200), (150, 250)]

    # 创建显示窗口
    plt.figure(figsize=(15, 10))

    # 原始图像和带噪声图像的Canny检测
    for i, (img_var, title) in enumerate(
        [
            (img, "Original"),
            (noise_low, "Low Noise"),
            (noise_medium, "Medium Noise"),
            (noise_high, "High Noise"),
        ]
    ):
        for j, (low, high) in enumerate(thresholds):
            canny_result = cv2.Canny(img_var, low, high)
            plt.subplot(4, 3, i * 3 + j + 1)
            plt.imshow(canny_result, cmap="gray")
            plt.title(f"{title}\nThreshold: {low}-{high}")
            plt.axis("off")

    plt.tight_layout()
    plt.show()
4.1功能
这个函数给图片加上不同程度的“雪花点”(高斯噪声),然后用 Canny 方法找边缘,看看噪声和阈值对结果的影响。
4.2 代码解释
4.2.1 添加高斯噪声
- def add_gaussian_noise(image, mean=0, sigma=25):
- 这是一个小函数,专门用来给图片加噪声。
- np.random.normal(mean, sigma, image.shape): 生成随机噪声,像电视上的雪花点,sigma 控制噪声的大小。
- noisy = image + gauss: 把噪声加到图片上。
- np.clip(noisy, 0, 255): 确保结果在 0-255 之间(超过的剪掉)。
- np.uint8(noisy): 转成显示用的格式。
- noise_low, noise_medium, noise_high:
- 用不同 sigma(15、30、50)生成三张噪声不同的图片,噪声越大,雪花点越多。
4.2.2 Canny 边缘检测
- thresholds = [(50, 150), (100, 200), (150, 250)]:
- 定义了三组低阈值和高阈值,后面会用它们测试 Canny。
- plt.figure(figsize=(15, 10)):
- 创建一个大画布,尺寸是 15×10 英寸,用来放多张图。
- for i, (img_var, title) in enumerate([…]):
- 循环处理四张图片:原图、低噪声、中噪声、高噪声。
- enumerate 给每张图一个编号 i 和标题 title。
- for j, (low, high) in enumerate(thresholds):
- 对每张图,再用三组阈值做 Canny。
- cv2.Canny(img_var, low, high): 用当前阈值找边缘。
- plt.subplot(4, 3, i * 3 + j + 1):
- 在 4 行 3 列的网格里选一个位置放图。
- plt.imshow(canny_result, cmap=”gray”):
- 显示边缘结果,用灰度颜色。
- plt.title(f”{title}\nThreshold: {low}-{high}”):
- 给每张图加标题,比如 “Low Noise Threshold: 50-150″。
- plt.axis(“off”):
- 去掉坐标轴,图更干净。
- plt.tight_layout():
- 自动调整布局,避免图挤在一起。
- plt.show():
- 显示所有 12 张图(4 张图片 x 3 组阈值)。
4.3 逻辑
- 给图片加不同程度的噪声。
- 对原图和带噪声的图,用三组不同阈值做 Canny。
- 把结果排成 4 行 3 列的网格显示出来。
5 主函数
def main():
    # 图像路径(需要替换为实际的cameraman.tif路径)
    image_path = "Cameraman.tif"

    # 1. 读取并显示图像
    img = read_and_display_image(image_path)

    # 2. 比较不同边缘检测算子
    edge_detection_comparison(img)

    # 3. 添加噪声并测试Canny阈值
    noise_and_canny(img)

    # 关闭所有窗口
    cv2.destroyAllWindows()


if __name__ == "__main__":
    main()
5.1 功能
主函数把前面三个部分串起来,跑一遍整个程序。
5.2 代码解释
- image_path = “Cameraman.tif”:
- 指定图片路径,你需要改成自己电脑里的真实路径。
- img = read_and_display_image(image_path):
- 调用第一个函数,读取并显示图片。
- edge_detection_comparison(img):
- 调用第二个函数,比较三种边缘检测。
- noise_and_canny(img):
- 调用第三个函数,加噪声并测试 Canny。
- cv2.destroyAllWindows():
- 关掉所有窗口,清理屏幕。
- if name == “main”::
- 这是一个习惯写法,确保 main() 只在直接运行这个文件时执行。
5.3 逻辑
- 读图片,显示。
- 比较三种边缘检测方法。
- 加噪声,测试 Canny。
- 最后收拾干净。


